Warehouse costs rarely jump because of one bad decision. They climb when a scheduled job scans more data, an idle compute cluster stays online, or a new dashboard becomes popular without an owner watching it.
SaaS warehouse costs become manageable when you can spot the change while it is still a small variance, not a painful month-end surprise. That requires more than a billing dashboard. You need current usage signals, clear attribution, alert rules, and a person who can act.
Start by separating the charges you pay, then build a monitoring loop around the work that creates them.
What belongs in SaaS warehouse costs
A single monthly total hides the reason spend increased. Break SaaS warehouse costs into cost types before setting a budget or alert.
Separate spend by cost driver
Most warehouse bills include some mix of the following:
- Compute covers query processing, virtual warehouses, clusters, slots, or other execution capacity.
- Storage covers data kept in tables, staging areas, backups, and time-travel or retention features.
- Data transfer covers movement between regions, clouds, services, or external destinations when your provider charges for it.
- Licensing and recurring charges include reserved capacity, platform subscriptions, support plans, connectors, and paid add-ons.
- Related services may include transformation jobs, ingestion tools, BI extracts, AI workloads, or orchestration runs.
Compute is usually the first place to look after a sudden spike. However, growing storage or a new transfer path can add recurring cost without appearing in query logs. Google’s BigQuery pricing overview separates query processing from storage, which illustrates why a single spend line is rarely enough for diagnosis.
Treat data freshness as a control limit
Billing data is useful, but it often arrives later than workload activity. A charge posted this afternoon may describe a job that ran this morning or yesterday.
Google notes that system delays can affect budget alerts, anomaly detection, and exported billing data in its billing reports documentation. Therefore, compare delayed billing records with fresher signals such as active compute time, query volume, bytes scanned, job failures, and data loaded.
A delayed billing feed should trigger investigation, not blind confidence that spend is stable.
Build a baseline for SaaS warehouse costs
A budget tells you where spending should stop. A baseline tells you whether today’s activity is normal. Build it before alerting, or your alerts will react to predictable busy days.
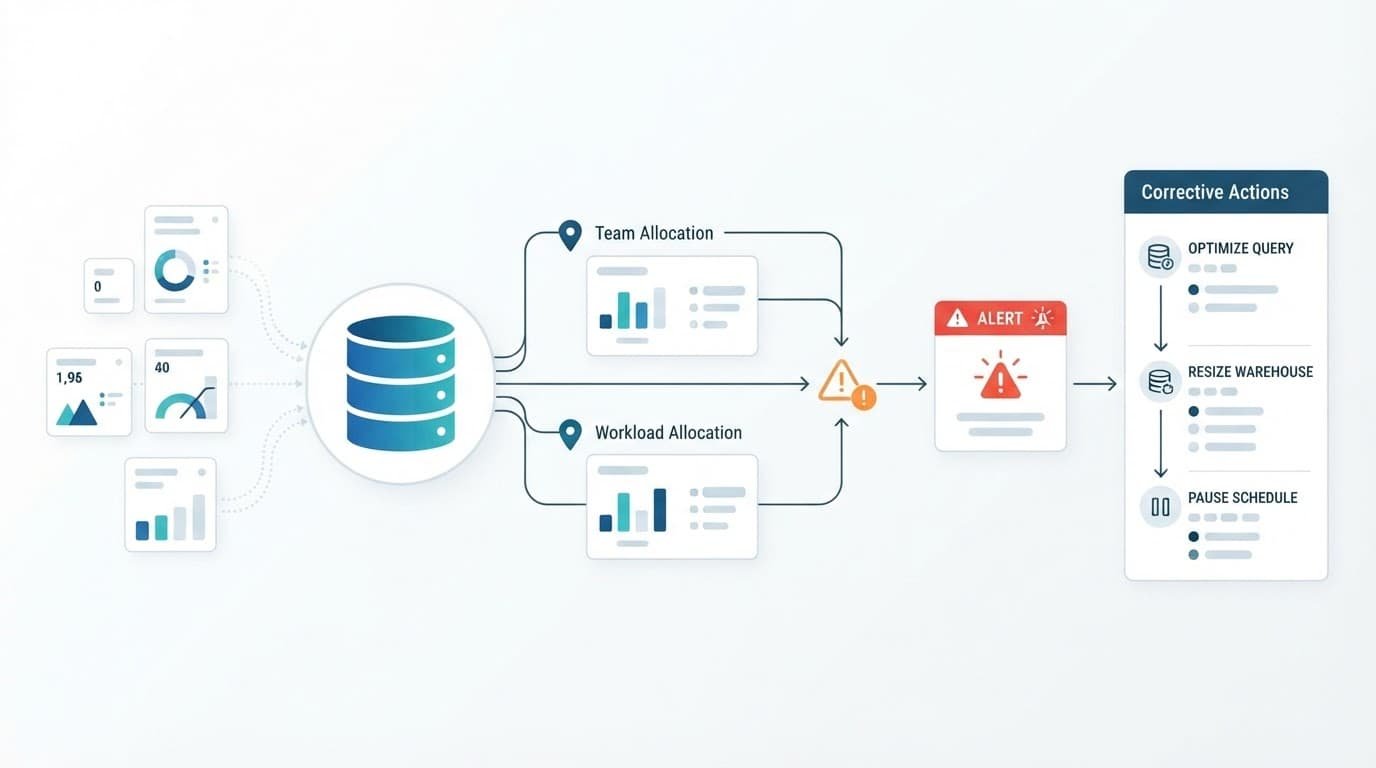
Create a usable data feed
Start with a small set of prerequisites:
- Read-only access to billing exports, warehouse usage history, and query or job logs.
- Stable identifiers for workspaces, teams, products, environments, and scheduled jobs.
- A shared reporting table or dashboard that joins usage records to cost records.
- A named budget owner who can approve a pause, scale-down, or configuration change.
For Google Cloud workloads, exporting billing data to BigQuery provides cost and usage data for analysis. Other platforms provide their own billing exports or usage tables. Keep raw records intact, then create a daily summary by workload and cost type.
Track both the usage timestamp and the billing-record arrival timestamp. That distinction exposes late data and prevents an old charge from looking like a new incident.
Calculate a baseline that matches real usage
Use comparable days, not a monthly average. Monday’s reporting load may be normal while Saturday’s is quiet.
A practical starting formula is:
Expected daily cost = median cost for the same weekday over the previous four to eight weeks
Then add unit metrics that explain the spend:
- Compute cost per scheduled run or completed model
- Cost per million rows processed or per terabyte scanned
- Storage cost per active customer, dataset, or retention tier
- Transfer cost per export job or destination
The median handles one-off spikes better than an average. Still, exclude unusual periods such as backfills, migrations, product launches, or outages. Record those exceptions in the dashboard so they do not distort future alerts.
Attribute spending to teams and workloads
A total with no owner creates weak decisions. Someone may see that compute rose 40%, yet nobody knows whether sales reporting, product analytics, or a data migration caused it.
Require allocation metadata at the source
Assign a small, consistent set of fields to each job, warehouse, workspace, or compute pool:
cost_center, team, product, environment, workload_type, and owner.
For example, a nightly customer-health model might carry customer-success, production, scheduled-transform, and the name of its operational owner. A developer’s ad hoc exploration should not inherit the production analytics label.
Snowflake documents tag and query-tag approaches in its cost attribution guidance. Databricks also documents billable usage records and tags in its cost monitoring system tables. The field names differ, but the operating rule stays the same: attach metadata before work runs.
Allocate shared capacity without false precision
Shared warehouses, shared clusters, and always-on tools create costs that no single query owns. Keep a separate shared-cost pool rather than forcing a questionable allocation.
When you need chargeback, use a documented formula:
Team allocated cost = direct tagged cost + shared-cost pool x team’s measured usage share
Use a usage share that fits the service, such as runtime, query count, bytes processed, active users, or scheduled runs. Apply the same method month after month. A rough but consistent allocation is more useful than a detailed calculation that changes whenever someone asks about it.
Keep an unallocated category visible. It is a cleanup queue for missing tags, not a place to hide spend.
Set alert thresholds that trigger useful action
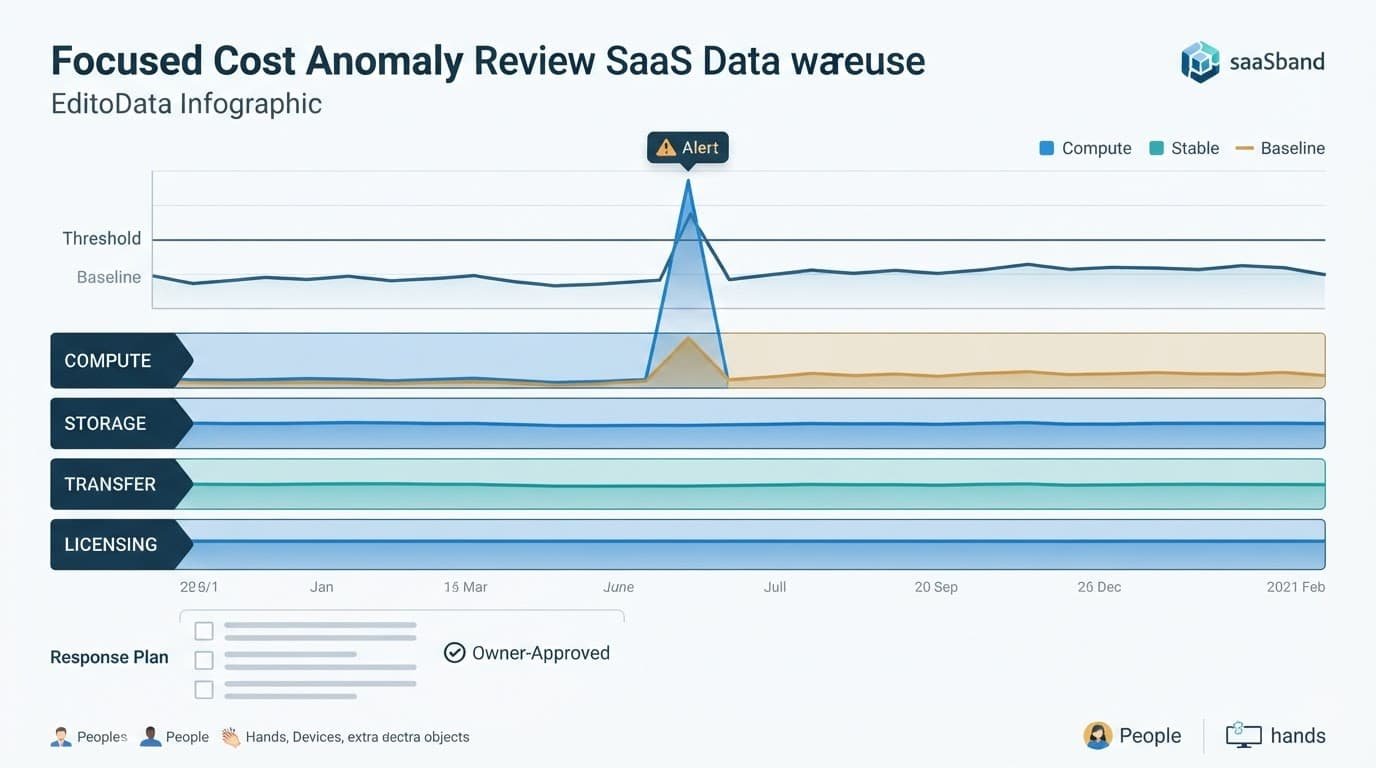
A budget alert catches total account spend. Workload alerts catch the behavior that creates it. Use both, because a small team can exceed a daily compute expectation long before the monthly budget looks unusual.
Pair absolute limits with rate-of-change alerts
An absolute threshold catches a large amount of spend. A rate-of-change threshold catches a sharp deviation on a smaller workload.
Use both formulas:
Variance percent = (current cost – expected cost) / expected cost x 100
Projected month-end cost = month-to-date cost / elapsed days x days in month
A threshold should include a materiality floor. For example, alert when compute is more than 50% above its baseline and exceeds an amount your business would investigate. That keeps a $3 variance from waking up the team.
Use this sample monitoring table as a starting point:
| Signal | Baseline | Alert condition | Owner | First check |
|---|---|---|---|---|
| Compute by workload | Same-weekday median | More than 50% above baseline and above materiality floor | Workload owner | Query volume, runtime, idle capacity |
| Data scanned or processed | 30-day median | More than two times normal for two runs | Analytics owner | Filters, partitions, joins |
| Storage growth | Previous day’s total | More than 10% growth in 24 hours | Data owner | Loads, retention, duplicate tables |
| Data transfer | Seven-day median | More than 40% above normal | Platform owner | Export job and destination |
| Recurring charges | Approved monthly amount | New or changed billing line | Finance owner | Seats, contracts, add-ons |
Keep severity tied to a response
Send a low-severity message for a first unusual data point. Escalate only when the variance persists, the projected monthly spend crosses a limit, or an absolute threshold is breached.
Group repeated alerts into one incident per workload and day. Also, suppress reminders until the owner changes the status or the variance worsens. This prevents alert fatigue while keeping unresolved spikes visible.
An alert without an owner, a freshness check, and a first action is only a more expensive dashboard notification.
Validate and contain cost anomalies
Alerts should begin a short investigation, not trigger an automatic shutdown that breaks customer-facing work.
Check the signal before interrupting jobs
First, confirm whether billing data arrived late or was corrected. Next, compare it with warehouse telemetry and query history. Then check for an approved launch, backfill, large import, or a reporting deadline that explains the increase.
Review the allocation tag as well. A correctly tagged migration has a different response from a production workload accidentally marked as unowned. If the alert is a false positive, record why and adjust the baseline or rule rather than muting the alert forever.
Contain the issue and record the fix
When the increase is real, the assigned owner should take the least disruptive action first. They may pause nonessential scheduled runs, stop a runaway query, reduce idle compute time, postpone a backfill, or correct an inefficient model.
Afterward, log the root cause, the cost impact, and the permanent change. Common fixes include tighter query filters, partitioning, shorter retention, schedule changes, workload separation, and tag enforcement.
Review unresolved high-severity alerts weekly. If the same workload appears repeatedly, its baseline, architecture, or owner assignment needs attention.
Keep Spend Visible Before It Becomes a Billing Surprise
The strongest control for SaaS warehouse costs is a daily view that ties every meaningful charge to a workload and an owner. Baselines show what normal looks like, while two-part thresholds surface the changes that deserve action.
Start today with your largest compute workload. Export its usage data, assign an owner and tags, calculate a same-weekday baseline, and create one alert with a clear first response.
